In this article, I will explain how AWS Managed Grafana can be used to easily monitor CloudWatch Log Groups and metrics across entire AWS Organizations and create comprehensive dashboards. If needed, multiple AWS Accounts and Organizations can be connected to AWS Managed Grafana using the CloudWatch cross-account observability feature.

Overview of the solution
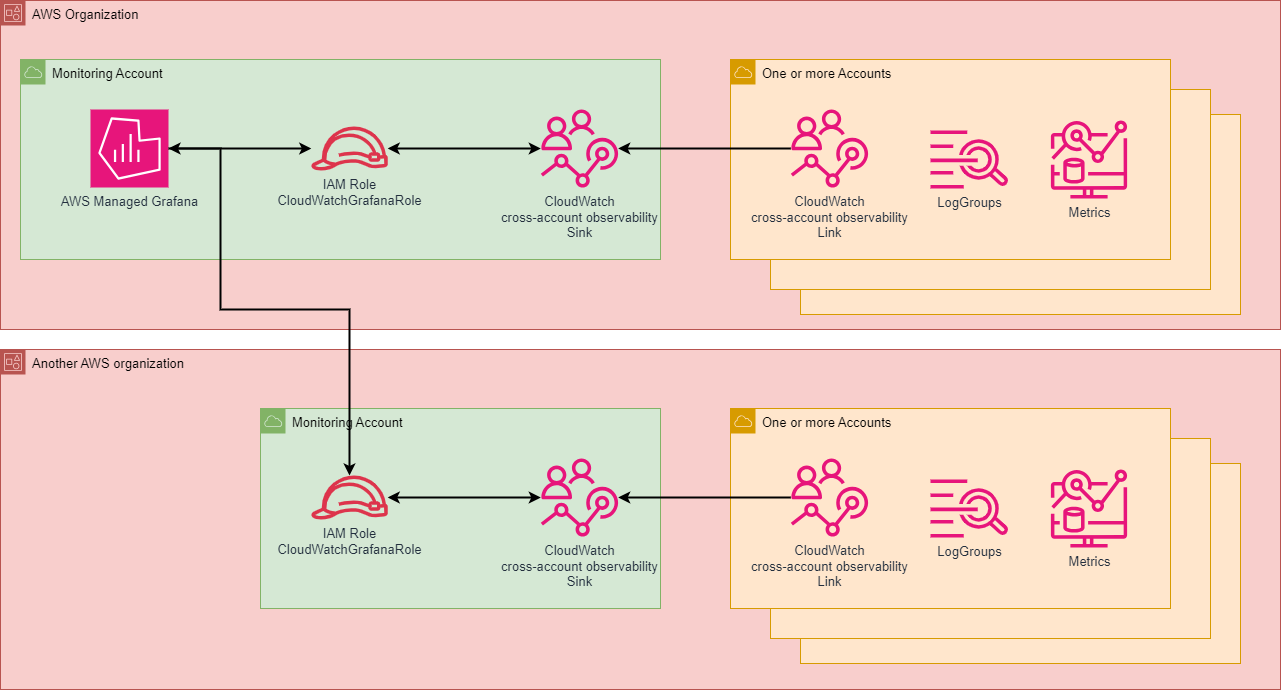
As shown in the architecture diagram, AWS Managed Grafana is created in a Monitoring AWS Account. Additionally, an IAM Role is created for each AWS Organization that needs to be connected. This role can be assumed by AWS Managed Grafana and has the CloudWatchReadOnlyAccess permission. The CloudWatch cross-account observability feature can also be activated in the Monitoring Account. To do this, a sink is created in the Monitoring Account, and a link is established in all AWS accounts that need to be connected.
This setup allows the IAM Role, and consequently AWS Managed Grafana, to access all CloudWatch Log Groups and metrics for which a link has been created.
This can also be used across multiple AWS Organizations by creating an IAM Role in the additional AWS Organization plus enabling CloudWatch cross-account observability.
Deployment of the Solution
1. Create CloudWatch cross-account observability Sink
In the Monitoring Account, the CloudWatch cross-account observability Sink is created using a CloudFormation template. If needed, the oam:ResourceTypes can be expanded; currently, only "AWS::CloudWatch::Metric" and "AWS::Logs::LogGroup" are authorized.
2. Create CloudWatch cross-account observability Link
In all accounts where Grafana needs to access CloudWatch LogGroups and metrics, the CloudWatch cross-account observability Link must be created using a CloudFormation template. This template can easily be rolled out as a StackSet across all desired accounts.
3. Create IAM Role for Grafana
In the Monitoring Account, the following IAM Role must be created, which can be assumed by Grafana with the CloudWatchReadOnlyAccess policy.
4. Create AWS Managed Grafana
In the Monitoring Account, Grafana can now be created. There are various options that can be chosen, such as PluginAdminEnabled or AuthenticationProviders. Below is a CloudFormation template that works for the solution I have described and uses AWS Identity Center as the Authentication Provider.
At the location Resources -> AmazonGrafanaWorkspaceIAMRole -> Properties -> Policies -> PolicyDocument -> Statement -> Resource ->, all ARNs of the IAM roles created in Step 3 must be inserted.
Note: Steps 1-3 must be performed in each AWS organization that needs to be linked to Grafana!
Using the Solution
You can now add yourself as an admin through the Amazon Managed Grafana Service.

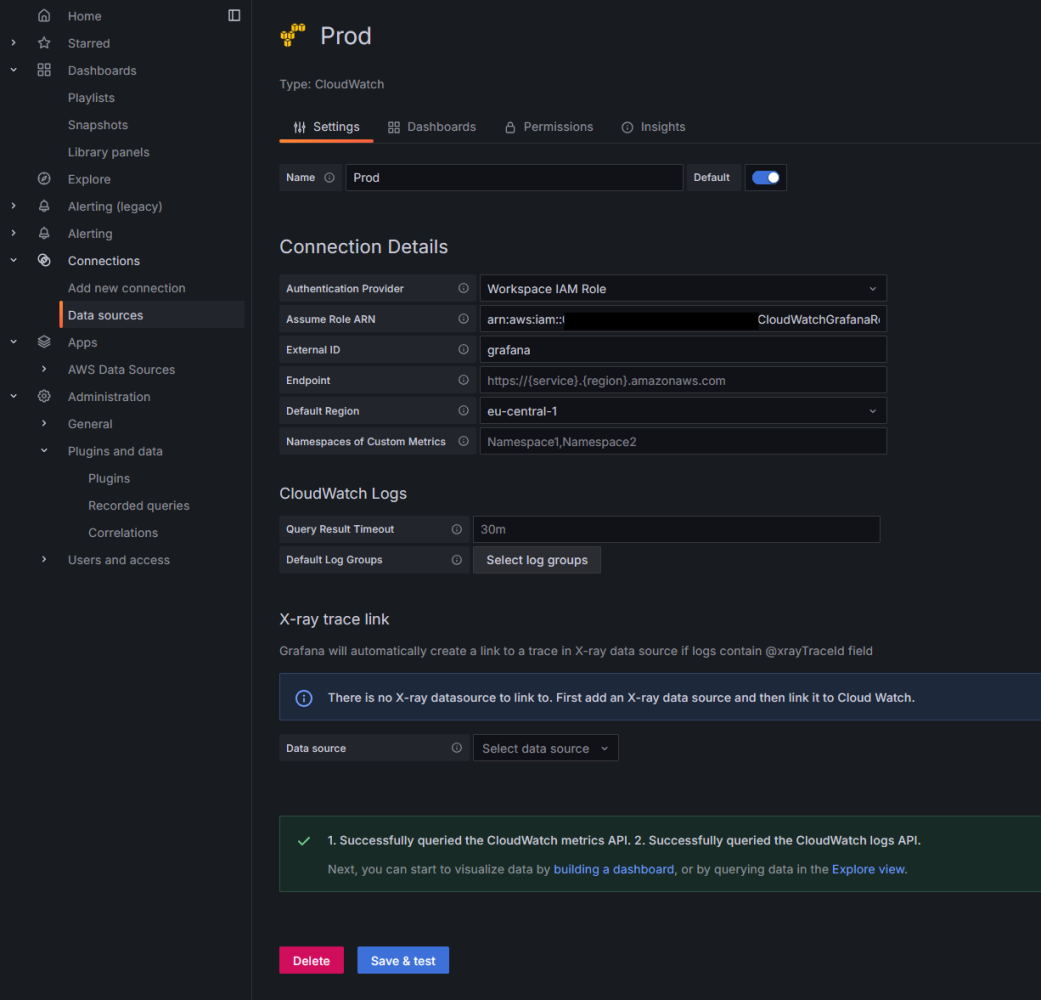
Afterwards, you need to connect the data sources. To do this, simply enter the IAM roles of the individual AWS Organizations and click "Save & Test".

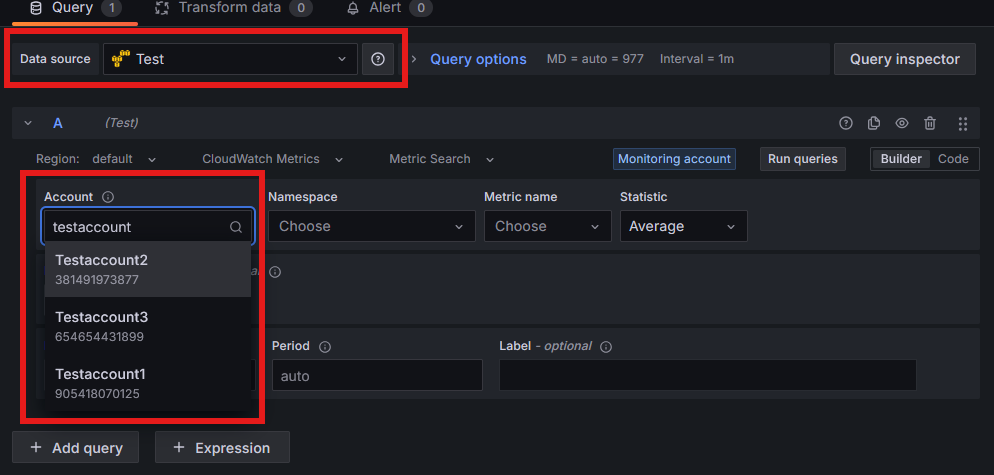
In this case, I have set up two data sources: one for the Prod AWS Organization and one for the Test AWS Organization.

Finally, you can now build dashboards as you like, accessing all CloudWatch Log Groups and metrics from all connected accounts.

Costs of the solution
Cross-account observability in CloudWatch comes with no extra cost for logs and metrics.
The Amazon Managed Grafana Service is priced based on active users, which provides an even more cost-effective solution. Here's how it works:
- Admin/Editor User: $9 USD per active user per month
- Viewer User: $5 USD per active user per month
Importantly, billing is based on active users, not the total number of users with access. For example:
If you've granted access to 100 Editors and 100 Viewers, but in a given month only 20 Editors and 30 Viewers actually log in to the workspace, you'll only be billed for those active users: 20 Editors and 30 Viewers.
This solution offers great value for your money. It lets you monitor multiple AWS Organizations from one place at a low cost per user. It's especially useful for companies with many AWS accounts that need to keep an eye on everything at once.
Final Words
This AWS Managed Grafana solution for monitoring multiple AWS Organizations showcases the power of cloud-native tools in simplifying complex monitoring tasks. It offers a centralized, cost-effective, and scalable approach to overseeing diverse AWS environments.
Key benefits include:
- Simplified monitoring across multiple AWS Organizations
- Cost-effectiveness with active user-based pricing
- Easy scalability as your infrastructure grows
- Secure monitoring using AWS's built-in features
- Customizable dashboards for specific needs
I hope you found this article helpful and informative. Implementing this solution can greatly enhance your AWS monitoring capabilities, but we understand that every organization has unique needs and challenges.
If you need assistance in setting up this solution, customizing it for your specific requirements, or have any questions about AWS monitoring and management, please don't hesitate to reach out to our team at PCG.
Check out our AWS Landing Zone & Monitoring!
Feel free to share your feedback and thoughts on the topic!
